
Dashboard Overview
The Dashboard is the home screen of the OffZio performance tracking platform. It gives Network Admins a live snapshot of traffic, conversions, revenue, payout, and profit so you can manage advertisers, publishers, and campaigns from one place.
Use this guide to understand every section of the Dashboard, what each metric means, and how to take the most common actions without leaving the page.
What is the Dashboard?
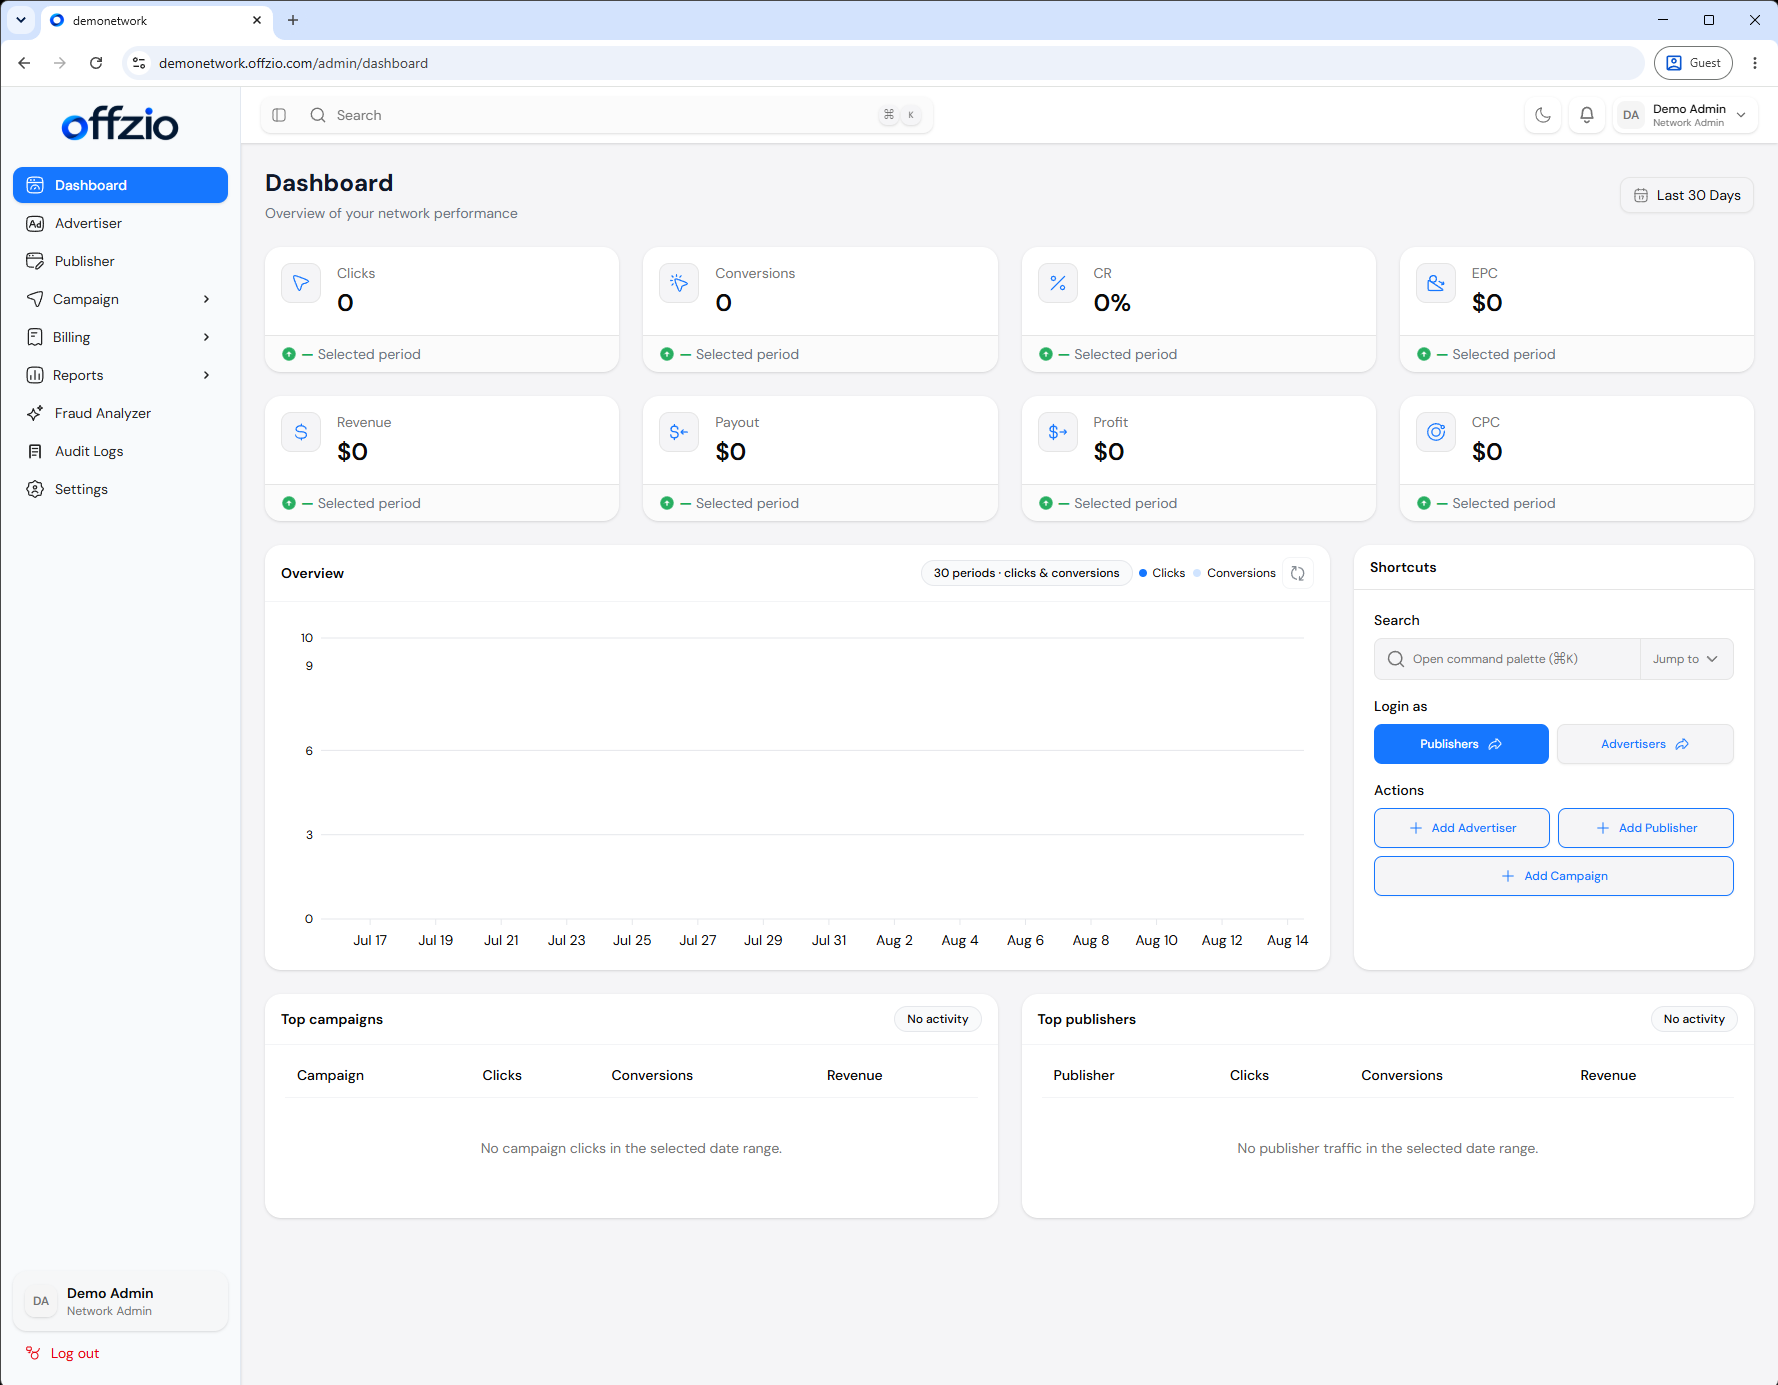
OffZio is a Cost-Per-Action (CPA) network platform. Advertisers run campaigns, publishers send traffic, and OffZio tracks every click and conversion so the network can pay partners accurately and measure profit.
The Dashboard is designed for daily operations. After you sign in as a Network Admin, it answers four questions immediately:
- Volume: How many clicks and conversions happened in the selected period?
- Quality: What is the conversion rate (CR) and earnings per click (EPC)?
- Money: How much revenue, payout, and profit did the network generate?
- Winners: Which campaigns and publishers are driving the most revenue?
Note: The numbers on the Dashboard always respect the date range in the top-right corner (for example, Last 30 Days). Change the period first if the figures look lower or higher than expected.
Who can access the Dashboard?

The screen shown in this article is the Network Admin Dashboard. In OffZio, your profile card (bottom of the sidebar and top-right of the header) displays your name and role — for example, OffZio Admin · Network Admin.
- Network Admin — Full network Dashboard: all advertisers, publishers, campaigns, billing, fraud, audit logs, and settings.
- Publisher — A publisher-scoped view of their own traffic, conversions, and earnings. Admins can jump into this view with Login as Publisher.
- Advertiser — An advertiser-scoped view of their campaigns, conversions, and spend. Admins can jump into this view with Login as Advertiser.
Screen layout
The Dashboard is divided into five areas. Learn these once and every later page in OffZio will feel familiar.
1. Left sidebar
Primary navigation to Advertiser, Publisher, Campaign, Billing, Reports, Fraud Analyzer, Audit Logs, and Settings. Your profile and Log out sit at the bottom.
2. Top header
Global search, theme toggle, notifications, and your signed-in identity.
3. KPI strip
Eight summary cards for Clicks, Conversions, CR, EPC, Revenue, Payout, Profit, and CPC for the selected period.
4. Overview + Shortcuts
A daily clicks/conversions chart on the left and a quick-actions panel on the right.
5. Rankings
Two lists at the bottom show Top Campaigns and Top Publishers by revenue for the same date range.
Left navigation

Use the sidebar to move between OffZio modules. Dashboard is highlighted when you are on the home screen.
- Dashboard — Network-wide performance snapshot (this page).
- Advertiser — Create and manage advertising partners who fund campaigns.
- Publisher — Create and manage affiliates who send traffic to offers.
- Campaign — Create, edit, and organize offers / campaigns. Opens a submenu.
- Billing — Invoices, payouts, and financial transactions. Opens a submenu.
- Reports — Detailed performance reports beyond the Dashboard snapshot. Opens a submenu.
- Fraud Analyzer — Inspect suspicious traffic and protect advertiser spend.
- Audit Logs — A complete activity history of changes made in the platform.
- Settings — Network configuration, branding, tracking, and account preferences.
Note: Only users with Network Admin privileges should change Settings or review Audit Logs. Use Log out at the bottom of the sidebar when you finish a session, especially on a shared computer.
Header, search, and account controls
The header stays available on every page.
- Search: Type a campaign, publisher, advertiser, or other record name to jump directly to it.
- Theme: Switch between light and dark mode.
- Notifications: Review system alerts such as conversions, billing events, or fraud flags.
- Profile: Confirms you are signed in (for example, OffZio Admin) and your role (Network Admin).
Selecting a date range

In the top-right of the main content area, open the period control (default: Last 30 Days). Every KPI, the Overview chart, Top Campaigns, and Top Publishers update together.
- Click the date-range button in the top-right of the Dashboard.
- Choose a preset (for example last 7 days, last 30 days) or a custom range.
- Confirm the selection. Wait a moment for cards, chart, and rankings to refresh.
Tip: Compare the same weekday or the same campaign launch window when you review profit. A short range can make CR look unusually high if volume is small.
Performance KPI cards

Eight cards sit under the page title. Each card shows the metric name, the value for the selected period, and a small trend indicator when comparison data is available.
- Clicks — Tracked visits sent by publishers to campaign landing pages.
- Conversions — Successful actions (leads, sales, or other CPA events) credited to the network.
- CR — Conversion Rate — conversions divided by clicks, shown as a percentage.
- EPC — Earnings Per Click — revenue generated for each tracked click.
- Revenue — Amount billed to advertisers for approved conversions.
- Payout — Amount owed to publishers for those conversions.
- Profit — Network margin: Revenue minus Payout.
- CPC — Cost Per Click from the network’s payout perspective (payout ÷ clicks).
How metrics are calculated
OffZio uses standard CPA-network formulas. Understanding them helps you explain results to partners.
- CR (Conversion Rate) —
Conversions ÷ Clicks × 100. Example from a 30-day window: 10 ÷ 23 × 100 = 43.48%. - EPC (Earnings Per Click) —
Revenue ÷ Clicks. Example: $35 ÷ 23 = $1.52. - Profit —
Revenue − Payout. Example: $35 − $30 = $5. - CPC (Cost Per Click) —
Payout ÷ Clicks. Example: $30 ÷ 23 = $1.30.
Note: High CR on very low click volume is not always a quality signal. Always read CR and EPC together with Clicks. If clicks are near zero, wait for more traffic before pausing or scaling a campaign.
Overview chart

The Overview card plots daily volume across the selected period. Blue bars are Clicks. Light-blue bars are Conversions.
Chart controls
- Use the period control on the chart to align the graph with a specific window.
- Toggle Clicks or Conversions on or off if you want to isolate one series.
- Hover a bar to see the exact count for that day.
Spikes usually mean a campaign went live, a publisher increased traffic, or a promotional burst occurred. Flat days often mean a campaign was paused, creatives were rejected, or traffic was capped.
Shortcuts panel

The right-hand Shortcuts panel is built for operators who create partners and campaigns many times a day.
- Search Ctrl + K (Windows) or Command + K (Mac) — Opens the command palette. Jump to a page or record without using the sidebar.
- Login as Publisher — Impersonate a publisher account to verify links, postback setup, and what the partner sees.
- Login as Advertiser — Impersonate an advertiser account to confirm campaign delivery and reporting.
- + Add Advertiser — Create a new advertiser record.
- + Add Publisher — Create a new publisher / affiliate record.
- + Add Campaign — Create a new offer. This is the primary growth action on the Dashboard.
Note: Always return to your Network Admin session after using Login as. Do not approve billing or change Settings while impersonating a partner.
Top Campaigns and Top Publishers

The bottom of the Dashboard ranks performance so you can see where money is actually being made — not only where traffic is being sent.
Top Campaigns
Campaigns are listed by revenue for the selected period. Typical columns:
- Campaign name — for example, a geo- and device-specific offer such as a USA web+mobile premium campaign.
- Clicks — traffic received.
- Conversions — credited actions.
- Revenue — advertiser value generated.
Top Publishers
Publishers are ranked the same way so you can identify your highest-value traffic sources.
Tip: If one publisher accounts for nearly all revenue, treat that as a concentration risk. Open Fraud Analyzer and Reports before you scale that source further.
Common tasks
Review yesterday’s performance
- Set the date range to Yesterday or Last 7 Days.
- Confirm Clicks, Conversions, Revenue, and Profit look healthy.
- Scan the Overview chart for unexpected drops.
- Open the top campaign and top publisher if a number looks unusual.
Onboard a new offer
- Click + Add Campaign in Shortcuts.
- Attach the advertiser, payout, geo, and tracking settings.
- Create or assign publishers.
- Return to the Dashboard after traffic starts and watch the KPI cards.
Investigate a profit drop
- Check whether Revenue fell, Payout rose, or both.
- Compare Top Campaigns — did a high-margin offer stop converting?
- Compare Top Publishers — did a source send low-quality clicks?
- Open Fraud Analyzer if CR collapsed while clicks increased.
- Use Reports for a breakdown by country, device, or sub-publisher.
Best practices
- Start every workday on the Dashboard before opening individual campaigns.
- Never optimize on CR alone. Pair it with Clicks, EPC, and Profit.
- Use Login as Publisher after you create tracking links, so you see exactly what the partner sees.
- Keep Audit Logs in mind: every create/edit action is recorded for compliance.
- If notifications show billing or fraud alerts, handle those before scaling traffic.
Was this article helpful?